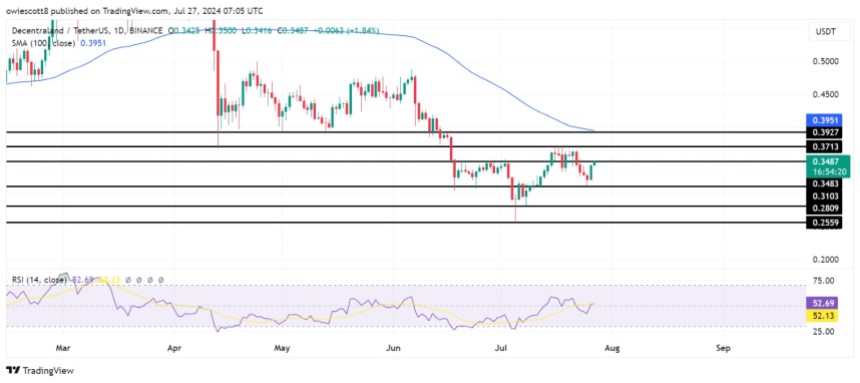
In the dynamic realm of cryptocurrency trading, certain digital currencies capture the spotlight with their remarkable price movements, hinting at broader market sentiments and potential future directions. Among these standout tokens is Decentraland (MANA), which has recently showcased a significant bullish momentum. Observing the token’s latest trajectory, it is apparent that a renewed sense of market optimism is burgeoning, with MANA stepping back into the bullish arena. The price aims to breach the notable resistance mark at $0.3713, a movement underscored by a convincing price rejection at $0.3099. This event was notably marked by the formation of a hammer candlestick pattern, a bullish indicator in the eyes of seasoned investors.
This uptick in MANA’s fortunes has not gone unnoticed by the trading community. Investors and market watchers are keenly observing, anticipating the next move as the digital asset edges closer to the critical $0.3713 resistance level. Such a scenario brings a heightened level of anticipation, especially among those keen on leveraging the expected upward trajectory for potential gains.
The pulse of the current bullish sentiment surrounding MANA is not just a matter of casual observation. Instead, it’s backed by a detailed analysis of technical indicators and prevailing market trends. By dissecting these elements, one can unearth valuable insights into potential resistance and support levels that the digital asset might encounter. This article will delve into these aspects, offering a comprehensive outlook on the overall market scenario as it stands.
As of the latest market data, MANA registers its trading price at roughly $0.3472, indicating a 5.41% uptick. Its market capitalization has surged over $662 million, complemented by a trading volume surpassing $33 million. The last 24 hours have been particularly noteworthy, with MANA’s market capitalization marking a 5.51% increase, amid a 16.99% dip in trading volume.
Technical Analysis: Current Market Sentiment And Trends
The four-hour chart reveals MANA’s intense bullish momentum, with its price surpassing the $0.3483 threshold and ambitiously pushing towards the key $0.3713 resistance level. The token’s successful navigation above the 100-day Simple Moving Average (SMA) suggests a bullish trend gaining ground, bolstered by growing market confidence.
The Relative Strength Index (RSI) on the 4-hour chart breached the 50% mark, now advancing towards the 70% level, typifying the overbought territory. This upward trajectory in the RSI underscores a strengthening buying pressure, fortifying the bullish momentum MANA is experiencing.
On the daily chart, although MANA is still navigating below the 100-day SMA, the emergence of a hammer candlestick pattern succeeded by a bullish engulfing candle paints a promising picture. This sequence hints at a potential shift from a downtrend to an uptrending momentum.

The RSI indicators on the daily chart bolster the speculations of a continued bullish rally for MANA, aiming at the $0.3713 resistance level. With the RSI line edging above 50%, the signals are optimistic for the asset’s near-term trajectory.
Potential Scenarios For MANA
Currently, MANA is on a bullish upswing, eyeing the pivotal resistance at $0.3713. A successful breakthrough above this threshold could propel the digital asset towards further gains, potentially reaching the $0.3927 resistance and possibly extending beyond.
However, should MANA encounter resistance at the $0.3713 mark and fail to secure a position above it, the outcome could lead to a retracement or a period of consolidation. A subsequent fall through the support level at $0.3103 could indicate a trend towards further declines, targeting the $0.2809 mark and other conceivable support ranges.
Featured image from LinkedIn, chart from Tradingview.com
Conclusion: The Dynamic Dance of Decentraland (MANA)
In the intricate ballet of the cryptocurrency market, Decentraland (MANA) has danced its way into a potentially bullish crescendo. With each pivot and leap represented by hammer candlestick patterns and surges above significant moving averages, MANA’s recent movements paint a vivid picture of optimism and potential. While it strides confidently towards pivotal resistance levels, its journey encapsulates the eternal dance of supply, demand, and speculative sentiment that defines the crypto world.
Should MANA gracefully pirouette above the $0.3713 mark, its performance could beckon further gains, inviting investors and traders to partake in its success. Yet, in the unpredictable theater of digital assets, a misstep could see it retreating to lower support levels, underscoring the perpetual balance between risk and reward.
As we watch this captivating performance unfold, keeping a keen eye on technical indicators and market trends remains crucial. For those who are drawn to the rhythm of the cryptocurrency markets, exploring further analysis and staying informed with DeFi Daily News remains an excellent encore to this ongoing show.


