Investing and trading in the contemporary landscape of digital and traditional financial markets require a blend of intuition, experience, and, importantly, the right tools at one’s disposal. Among these indispensable tools are chart pattern cheat sheets, an essential asset for anyone looking to navigate the tumultuous waters of market variability. These detailed guides serve as a beacon, illuminating the path through the complex patterns that asset prices weave over time, offering traders and investors a clearer perspective on potential market movements.
In an era where decisions have to be made promptly, often on the basis of incomplete information, the clarity provided by a well-compiled chart pattern cheat sheet is invaluable. It simplifies the recognition and interpretation of chart patterns, rendering the vast and intricate analyses of technical experts more accessible. As these patterns play out on the screens of traders worldwide, quickly spotting a bullish breakout or foreseeing a bearish reversal can be the key to capitalizing on market movements.
Delving into the practical utility of chart pattern cheat sheets, particularly in the volatile domain of cryptocurrency trading, unveils a realm where these guides demonstrate their quintessential worth. The landscape of digital currencies, with its rapid price fluctuations and emerging trends, sets the stage for chart patterns to shine as indicators of potential trading prospects.
What Is a Chart Pattern?
At the heart of technical analysis, chart patterns emerge as formations that recurrently appear within the price charts of financial assets. These patterns provide a visual narrative of market sentiment, indicating potential future movements based on past and present price action. Chart patterns capture the psychological tug-of-war between buyers and sellers, offering clues to trends, reversals, and continuations that might unfold.
Despite their potential for forecasting, relying solely on chart patterns without considering other factors can sometimes lead to misleading interpretations. However, when applied judiciously, they become a powerful tool for deciphering the directions in which prices could head.
3 Major Chart Pattern Types
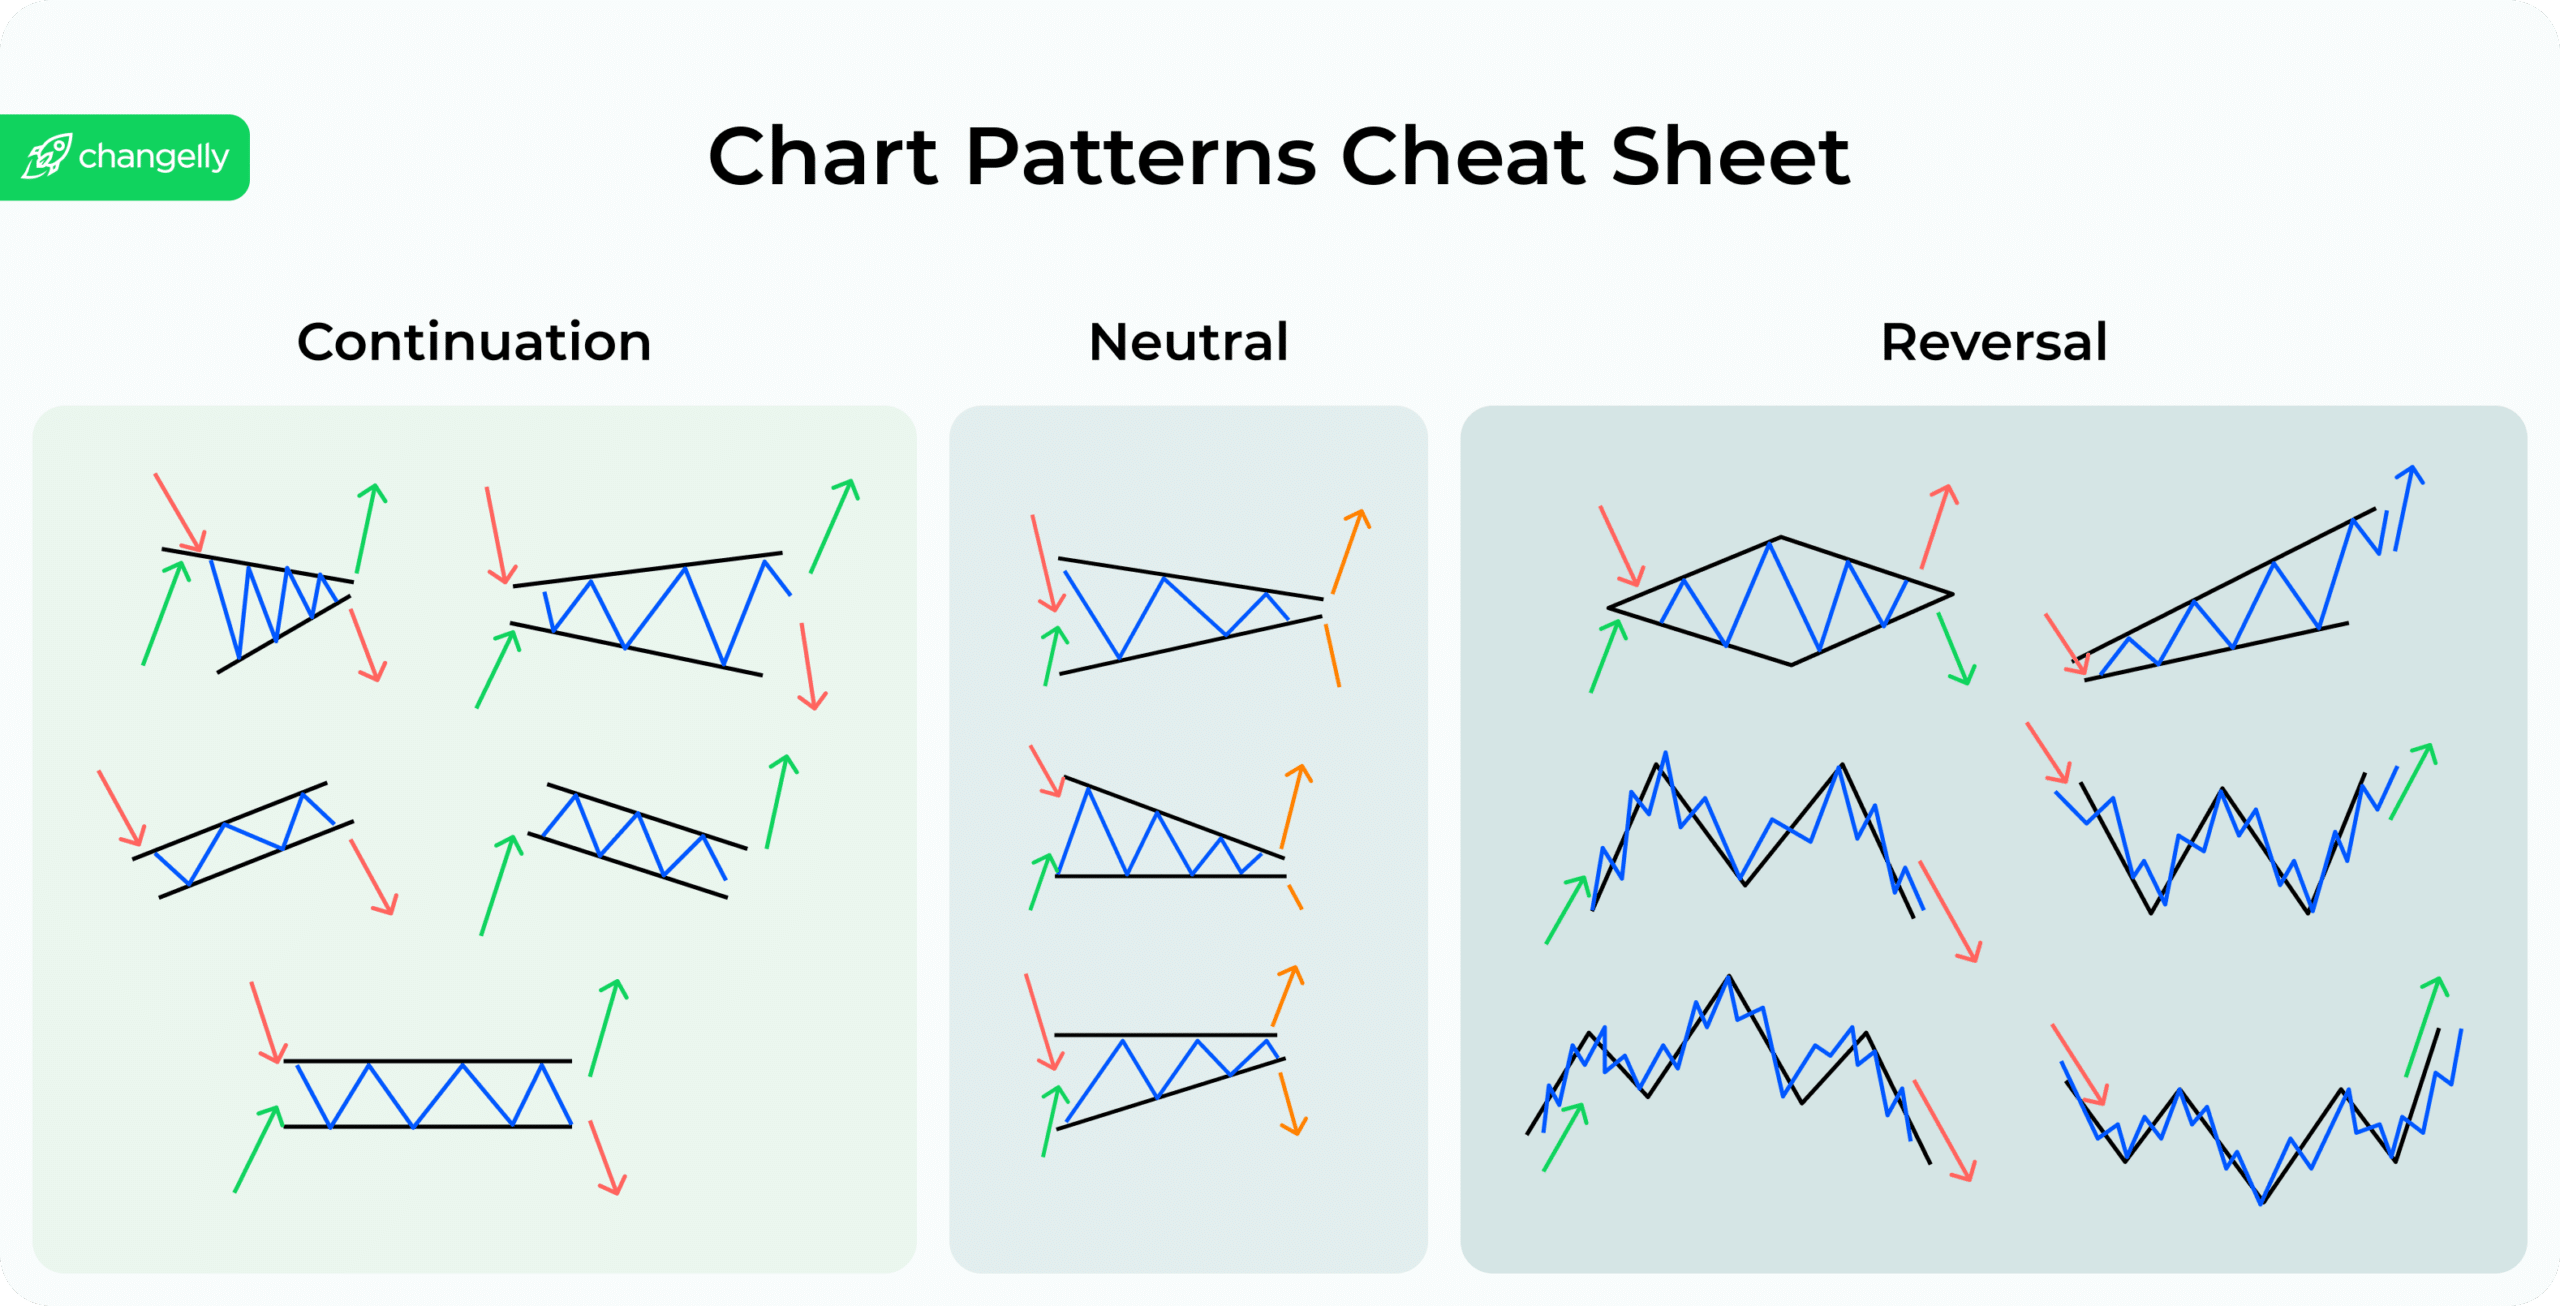
Chart patterns are categorized into three primary types: reversal, continuation, and bilateral, each signaling different market behaviors and potential price movements.
Bilateral
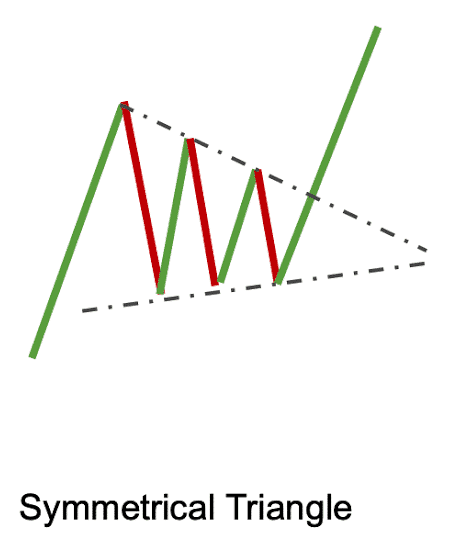
Bilateral patterns embody the market’s state of indecision, where the balance between buying and selling forces results in a pattern that could swing either way. These are the chameleons of the chart pattern world, as likely to herald a continuation of the current trend as they are to signal its reversal.

Among the most notable bilateral patterns are the Symmetrical Triangle and Rectangle patterns, each depicting a specific hold pattern in price action before a significant breakout or breakdown.
Continuation
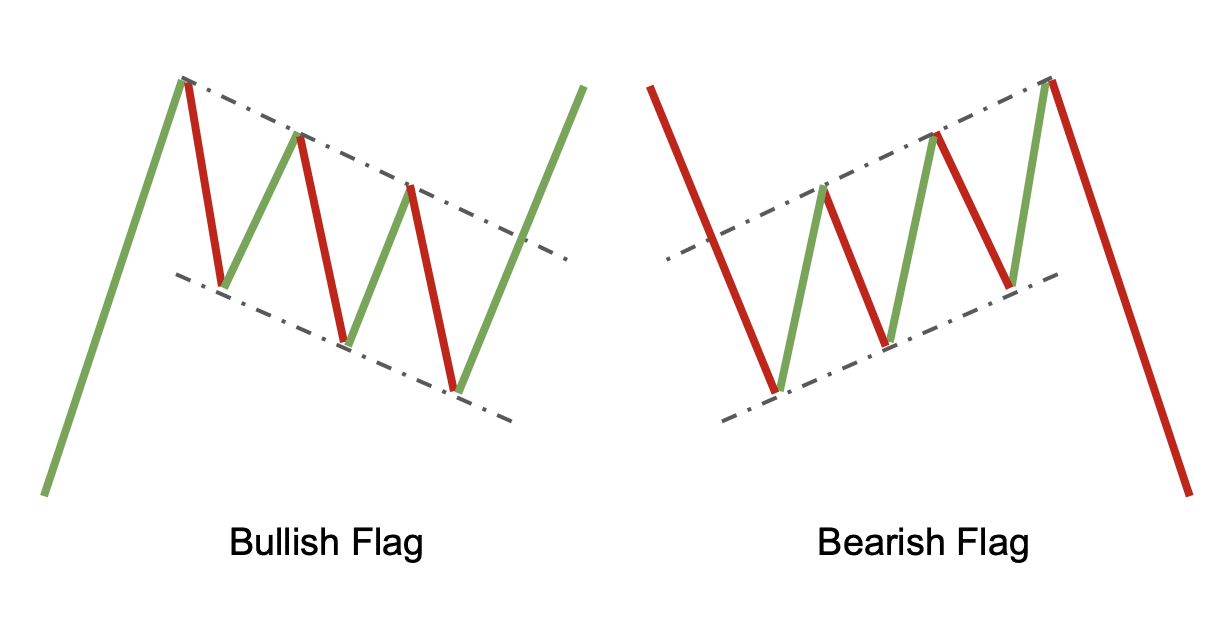
Continuation patterns suggest a pause in the prevailing trend, a momentary breath before the market resumes its prior direction. These patterns are the calm before the storm, signaling that the current trend, whether bullish or bearish, is expected to proceed once the pattern completes.

Flags and Pennants, along with Ascending and Descending Triangles, are prime examples of continuation patterns, providing traders the signal that the market’s prior momentum is likely to persist.
Reversal
Reversal patterns are the harbingers of change, indicating that the prevailing trend is potentially coming to an end and a new opposite trend could be on the horizon. These patterns are particularly significant as they can signal major market shifts.

Notable reversal patterns include the Head and Shoulders, and the Double Top/Bottom, each offering a precursor to a significant directional change in the market’s trajectory.
What Is a Chart Patterns Cheat Sheet?
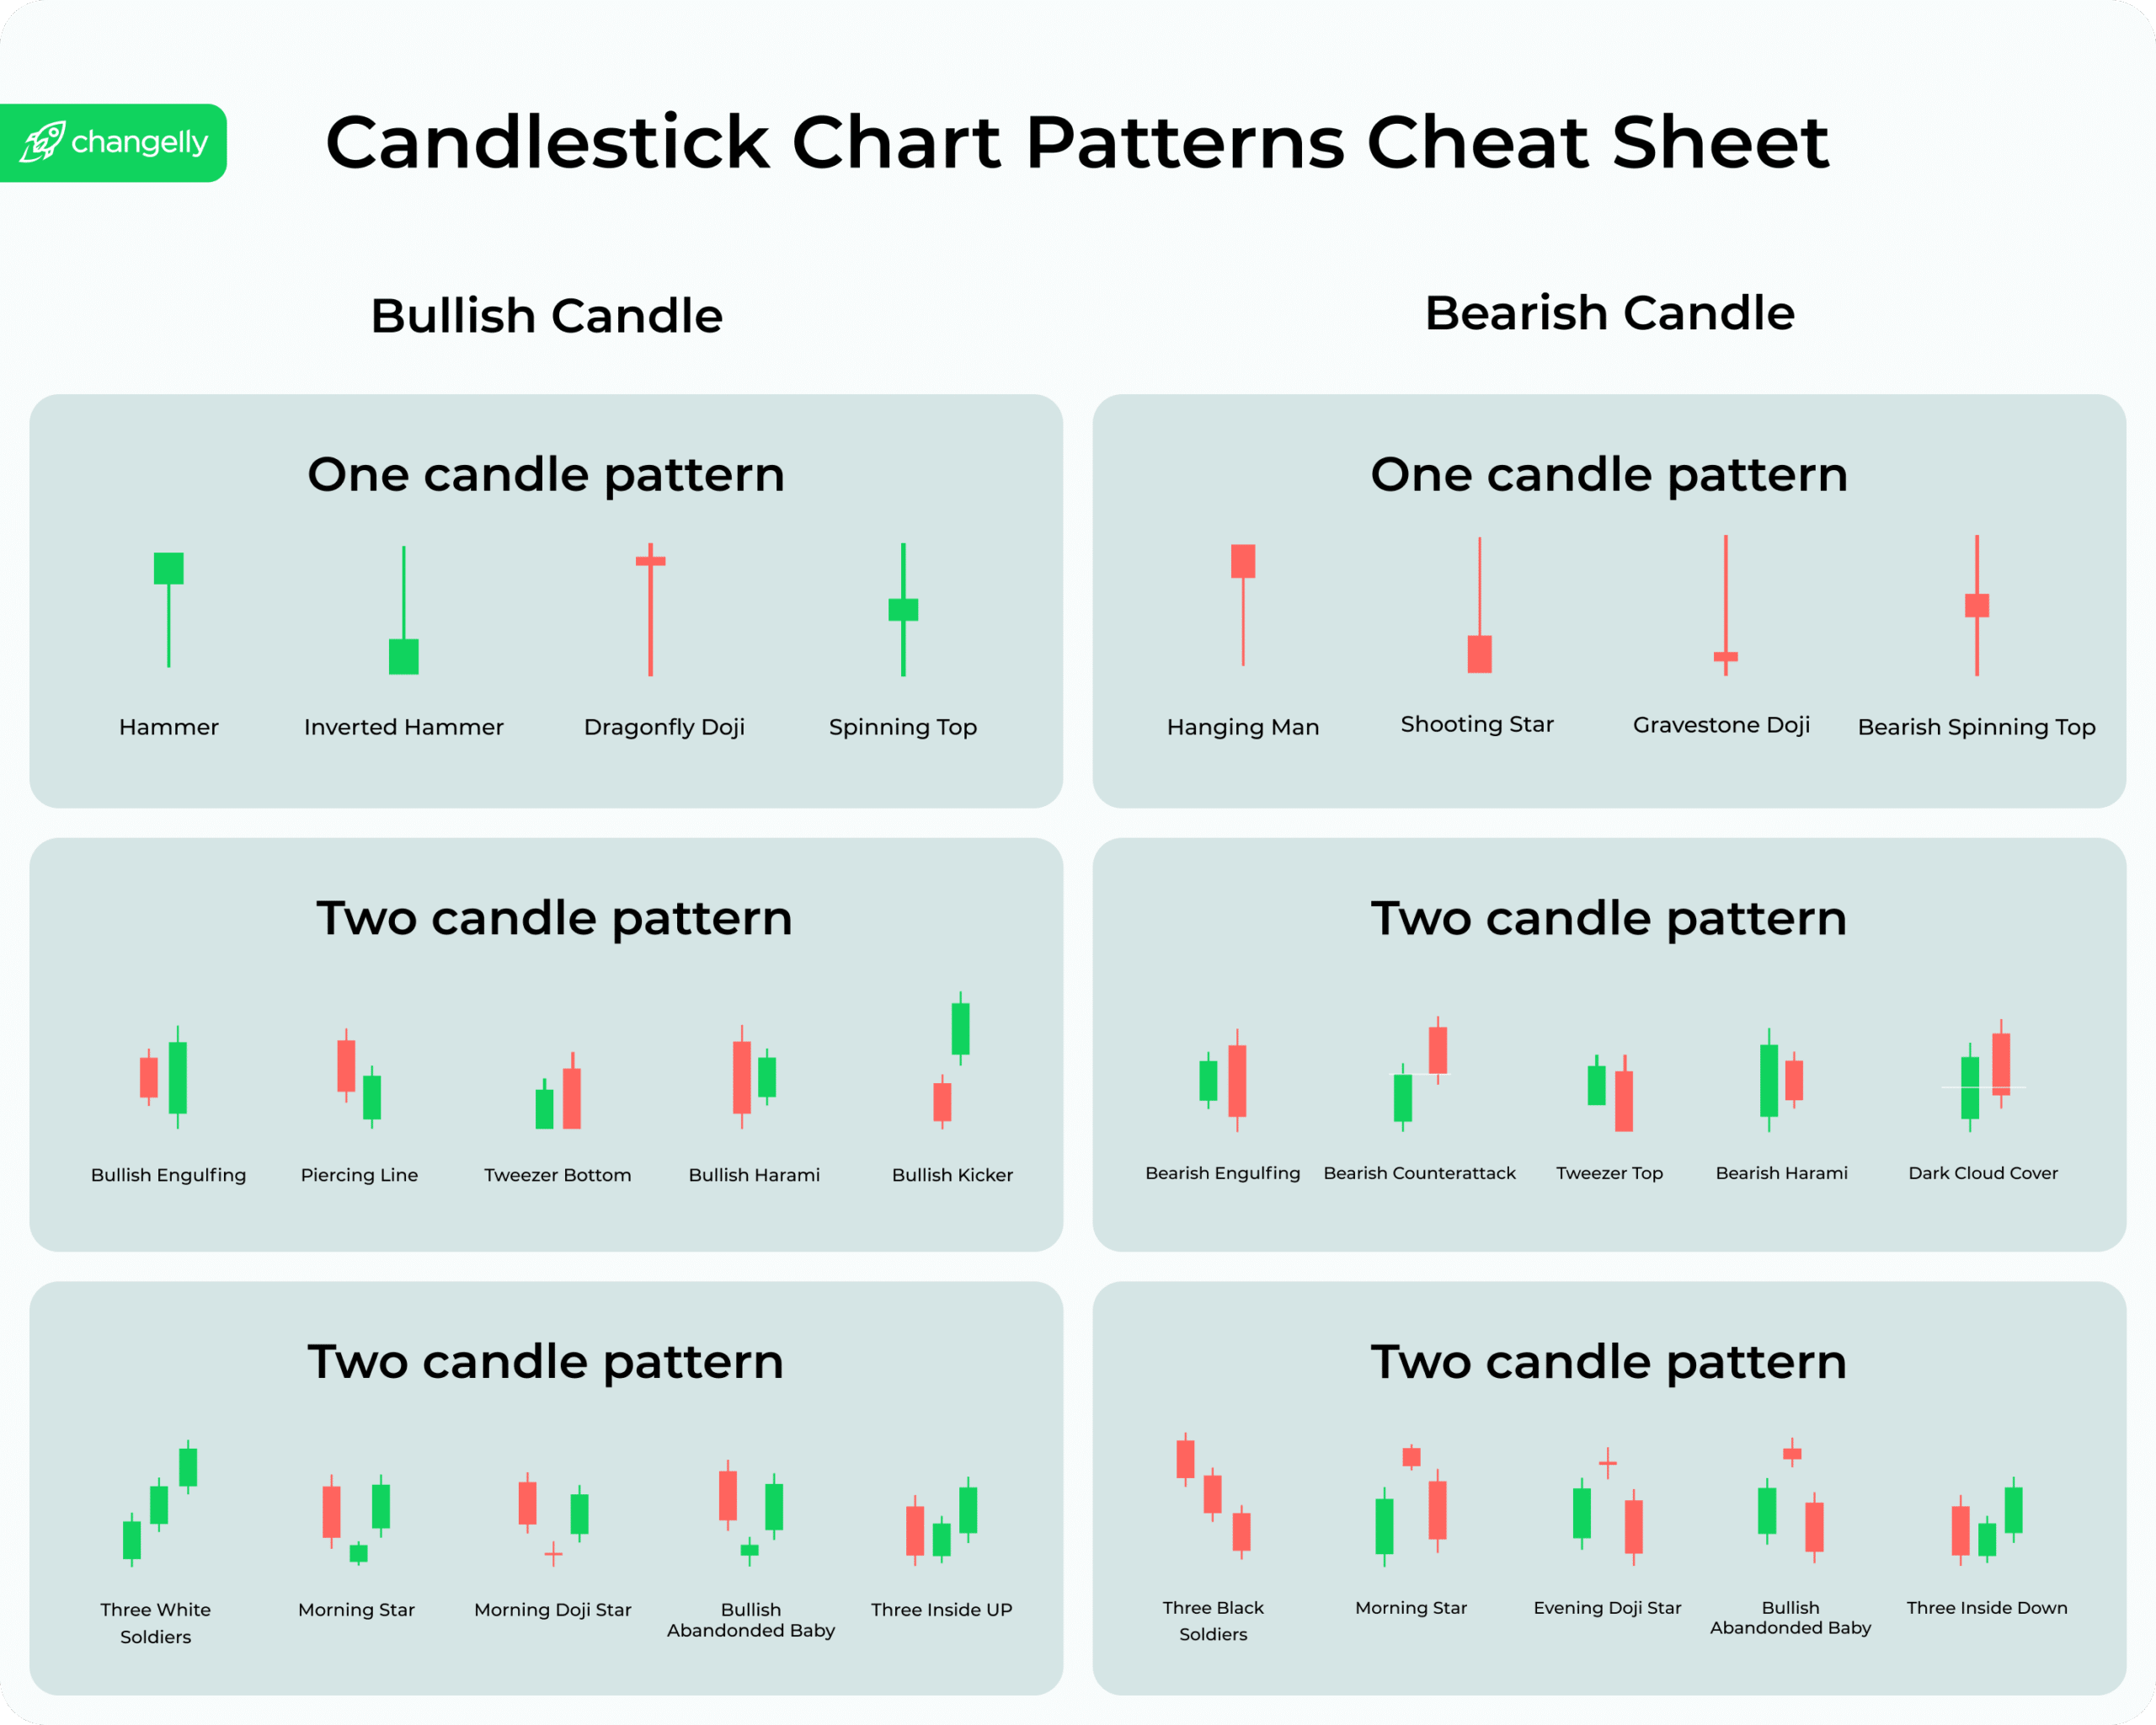
A chart pattern cheat sheet serves as a quick-reference guide, streamlining the process of identifying the myriad patterns that can appear on financial charts. It can be a digital document, integrated into trading platforms, or even a mobile app feature, providing at-a-glance access to key pattern formations and their implications.

These cheat sheets are not just a collection of diagrams; they encapsulate the essence of market analysis, offering a condensed view of potential price movements distilled from historical data. From beginner traders taking their first steps into the world of technical analysis, to seasoned professionals seeking a quick pattern reference, cheat sheets offer something of value to everyone in the trading arena.
How Do You Use a Chart Pattern Cheat Sheet?
The real power of a chart pattern cheat sheet lies in its application. From the basics of chart analysis to the identification of specific patterns, understanding when to enter or exit trades, and combining patterns with other technical indicators for a multi-faceted analysis, cheat sheets can significantly enhance trading strategies.
Beyond mere recognition, these sheets promote a deeper understanding of market dynamics, encouraging a more structured approach to trading where decisions are made not on whims but on well-recognized, historically backed patterns.
Can Chart Patterns Cheat Sheets Replace Technical Analysis?
While incredibly useful, chart pattern cheat sheets are but a single tool in the vast arsenal available to traders. They distill complex analyses into digestible formats but cannot and should not replace the comprehensive approach afforded by full technical analysis. The integration of cheat sheets with other analytical techniques enables traders to paint a fuller picture of the market, ensuring decisions are grounded in a broader understanding of market movements.
Chart Patterns Cheat Sheets and Crypto Trading
In the dynamic realm of cryptocurrency trading, where volatility is the norm and unpredictability comes hand in hand with unparalleled opportunity, chart patterns and their corresponding cheat sheets offer a semblance of order. By highlighting potential trends and reversals, they provide traders with crucial insights, albeit with a cautionary reminder of the inherent risks within such a fast-paced market.

Adopting chart patterns in crypto trading requires not just a keen eye for patterns but an awareness of the broader market context, blending technical analysis with fundamental insights and market sentiment to steer trades towards success.
FAQ
Are Chart Patterns Reliable?
Chart patterns serve as valuable tools within the trader’s toolkit, providing insights that, while not infallible, can guide trading strategies when used in conjunction with other analysis forms. Their reliability hinges not just on the patterns themselves but on the skillful interpretation and application by the trader.
Why Do You Need a Chart Pattern Cheat Sheet?
A chart pattern cheat sheet acts as a rapid reference tool, enabling traders to swiftly recognize and act upon emerging patterns. By encapsulating the essence of various chart formations, it assists in making informed trading decisions, especially useful in markets where speed is of the essence.
What Is the Most Profitable Chart Pattern?
The quest for the “most profitable” chart pattern is akin to the search for the Holy Grail in trading circles. While certain patterns like Head and Shoulders or Flags and Pennants consistently earns accolades for their predictive value, the true profitability of any pattern lies in its timely recognition and the strategic execution of trades it informs.
What Is a Forex Chart Patterns Cheat Sheet?
A Forex chart patterns cheat sheet specializes in the currency markets, offering traders insights into the frequent patterns that emerge amidst the unique liquidity and volatility of the Forex scene. It serves as a guide to navigating the forex markets with greater ease and confidence.
Disclaimer: Please note that the contents of this article are not financial or investing advice. The information provided in this article is the author’s opinion only and should not be considered as offering trading or investing recommendations. We do not make any warranties about the completeness, reliability, and accuracy of this information. The cryptocurrency market suffers from high volatility and occasional arbitrary movements. Any investor, trader, or regular crypto user should research multiple viewpoints and be familiar with all local regulations before committing to an investment.
For those seeking more insights and the latest in financial trends, DeFi Daily News offers a wealth of information and articles on a range of topics including cryptocurrency, market analysis, and much more.


