


In the ever-fluctuating world of cryptocurrencies, Ethereum (ETH) has recently caught the eyes of investors by initiating an upward trend. This change came about as it triumphantly broke above the 50-day Simple Moving Average (SMA) on the 19th of July, signaling a potential shift in market dynamics. This piece delves deep into the analysis, examining both the short and long-term perspectives surrounding Ethereum’s price motions.
When casting a glance at the long-term outlook for Ethereum’s valuation, we adopt a bullish stance. As of the 15th of July, there was a noticeable struggle among the bulls to maintain the price above the 50-day SMA. This turbulence led to a price movement bounded by the moving average lines over the subsequent days.
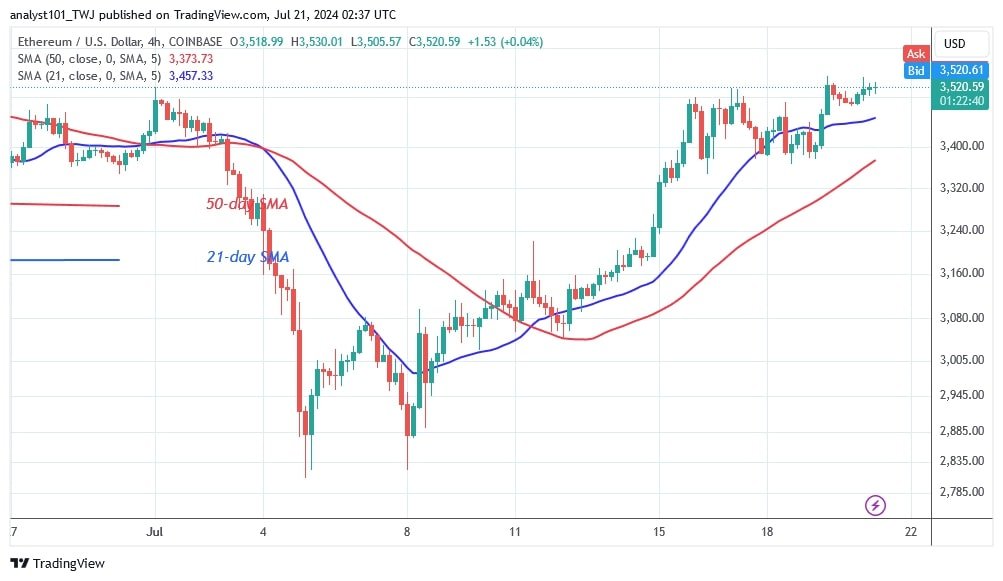
The foundation of our optimism lies in the robust support provided by the 50-day SMA. Should this support remain unbroken, it opens the door for Ethereum to embark on a rally towards the next resistance level pegged at $3,730. Should the bulls continue their charge, breaking past this resistance, Ethereum could very well extend its gains towards the $4,000 milestone. Conversely, a breakdown in support at the 50-day SMA could see the bears regain control, pushing Ethereum’s price into a consolidation phase within the moving averages, potentially dipping towards the $3,200 mark, just above the 21-day SMA.
Diving into the specifics, Ethereum’s recent comportment has seen it rebound above the 50-day SMA, marking a significant feat after multiple tests of this critical juncture. Currently, the price movements hover above the moving average lines, although a resistance at the $3,500 high poses challenges. The emergence of doji candlesticks signals a period of price stabilization, hinting at the market’s indecision.
The pressing question on everyone’s minds is: What direction is Ethereum headed next? From mid-July, particularly from the 15th onwards, Ethereum’s price trajectory has been predominantly horizontal, pinned below the $3,500 resistance level, as detailed analyses from Coinidol.com have brought to light. The 4-hour chart offers a snapshot of Ethereum trading in a rather confined range, hovering above the $3,400 support line but shy of breaching the $3,500 threshold. A leap above this barrier could catapult Ethereum to higher valuation levels. However, the presence of doji candlesticks suggests that there may be a temporary slowdown in price action.
Disclaimer. It’s crucial to underscore that the insights and forecasts herein reflect the personal viewpoints of the author. These should not be construed as investment advice or a solicitation to engage in cryptocurrency transactions. Neither should they be interpreted as endorsements by CoinIdol.com. Potential investors are urged to conduct thorough due diligence before making any financial commitments.
For enthusiasts craving more insights and updates on trending news in the digital finance sphere, I recommend checking out [DeFi Daily News](http://defi-daily.com) as your go-to source.
In concluding this analytical journey, Ethereum appears to be at a crucial juncture. As it teeters between pivotal support and resistance levels, the crypto community watches with bated breath. The dance between bulls and bears continues, weaving a tapestry rich in potential and rife with uncertainty. Whether Ethereum will soar to new heights or buckle under pressure remains a tale yet to unfold. One thing is for certain; the evolving narrative of Ethereum is nothing short of captivating, offering a blend of suspense, opportunity, and the unyielding spirit of innovation. Read the full story, and immerse yourself in the thrilling world of cryptocurrencies, where every day writes a new chapter in the annals of digital finance.


