


Puede encontrar una versión en español de este artículo aquí.
BNB has faced a significant rejection at a critical resistance level, raising concerns among traders about a potential price correction. After an impressive rally, the momentum has faltered, leaving the cryptocurrency at a crossroads.
This key level has proven to be a formidable barrier, indicating that selling pressure may be increasing as bears step in. However, the big question is whether this rejection marks the beginning of a downward correction or if the bulls can muster enough strength to regain their footing and continue pushing higher.
As the market navigates this pivotal moment, this piece will analyze BNB’s recent rejection at the critical resistance level and assess the implications for its price trajectory. By examining market trends, technical indicators, and trading volumes, this analysis will explore the possibility of a correction and what it could mean for traders.
Indicators Pointing Toward A Downside Correction For BNB
Recently, BNB’s price has turned bearish on the 4-hour chart, pulling back toward the 100-day Simple Moving Average (SMA) after facing rejection at the $605 resistance level. This downward move signals a shift in market sentiment as bulls struggle to maintain upward momentum. The rejection at the $605 resistance level has triggered heightened selling pressure that could push the price lower for a potential correction.
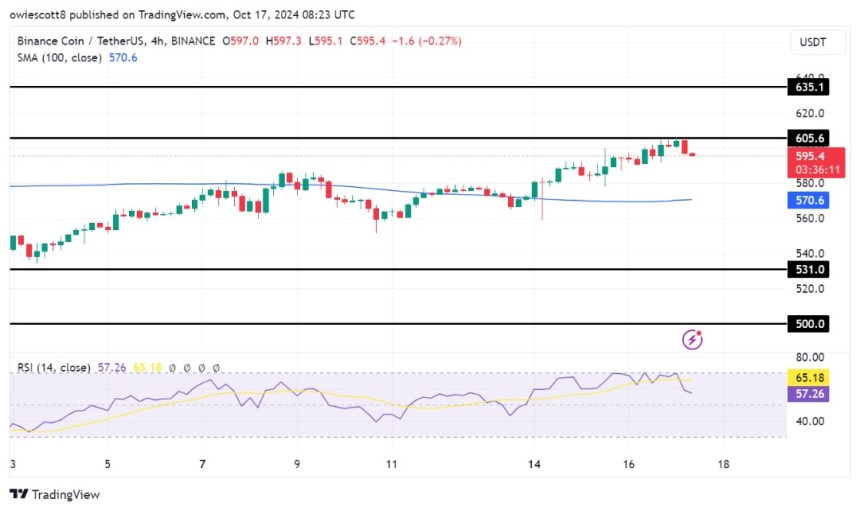 An analysis of the 4-hour Relative Strength Index (RSI) reveals that the signal line has dropped to 57%, retreating from its previous position in overbought territory. Typically, this decline indicates that the bullish momentum is weakening after reaching a peak, as buyers are beginning to lose steam.
Related Reading
Furthermore, on the daily chart, BNB is exhibiting negative momentum, as evidenced by the formation of a bearish candlestick, despite trading above the 100-day SMA. This situation reveals a possible contradiction in market sentiment. Meanwhile, if selling pressure continues and BNB is unable to maintain its position above the 100-day SMA, it may lead to a more significant price drop.
 Finally, on the 1-day chart, the RSI has experienced a decline to 69% after rising to 62%, reflecting strong optimistic sentiment and buying pressure. Although the RSI remains above 60%, which suggests a bullish outlook, the recent drop signals that the upward momentum may be slowing down.
Key Support Levels To Watch After The Rejection
Following BNB’s recent rejection at the $605 resistance level, the critical support zone to watch is around $531, where buying interest may emerge. If the price drops below this level, it could signal a deeper bearish move, with the potential to push BNB down toward the $500 mark and beyond. In addition, a break below these key levels could intensify selling pressure and set the stage for further declines, making them crucial areas for traders to monitor in the short term.
Related Reading
However, should the bulls manage to mount a comeback and push the price above $605, the asset could continue its upward movement toward the next resistance range at $635. A successful breach of this level may trigger additional gains, allowing the price to challenge other resistance points above.
Featured image from Adobe Stock, chart from Tradingview.com
Conclusion: Keeping A Close Eye On BNB’s Price Movements
In conclusion, BNB is currently facing a critical juncture in its price trajectory as it grapples with a significant rejection at a key resistance level. The indicators suggest a potential downside correction may be looming, with key support levels to watch for possible price drops.
Traders should pay close attention to the $531 support zone, as a breach below this level could lead to further bearish movements. On the other hand, if the bulls manage to reclaim control and push the price above $605, BNB could see a resurgence in positive momentum.
As the market continues to unfold, it remains essential for traders to stay informed and adapt their strategies accordingly. By monitoring key technical indicators and market trends, traders can position themselves to capitalize on potential price movements in BNB and navigate these uncertain times successfully.
For more insights and analysis on the latest trends in the cryptocurrency market, be sure to visit DeFi Daily News for up-to-date news and articles.


